 Image 1 of 1
Finally see the full picture of your group practice — without building a dashboard from scratch.
You know you should be tracking your numbers. Revenue, conversion rates, therapist utilization, marketing ROI — the metrics that actually tell you whether your practice is growing or just staying busy. But between running the clinical side, managing a team, and trying to keep your own caseload afloat, who has time to build a tracking system from zero?
This ready-to-use data dashboard gives you a complete, structured system for tracking every metric that matters in a group therapy practice — monthly. No spreadsheet skills required. No expensive software. Just open it, follow the step-by-step instructions, and start entering your numbers.
What's inside:
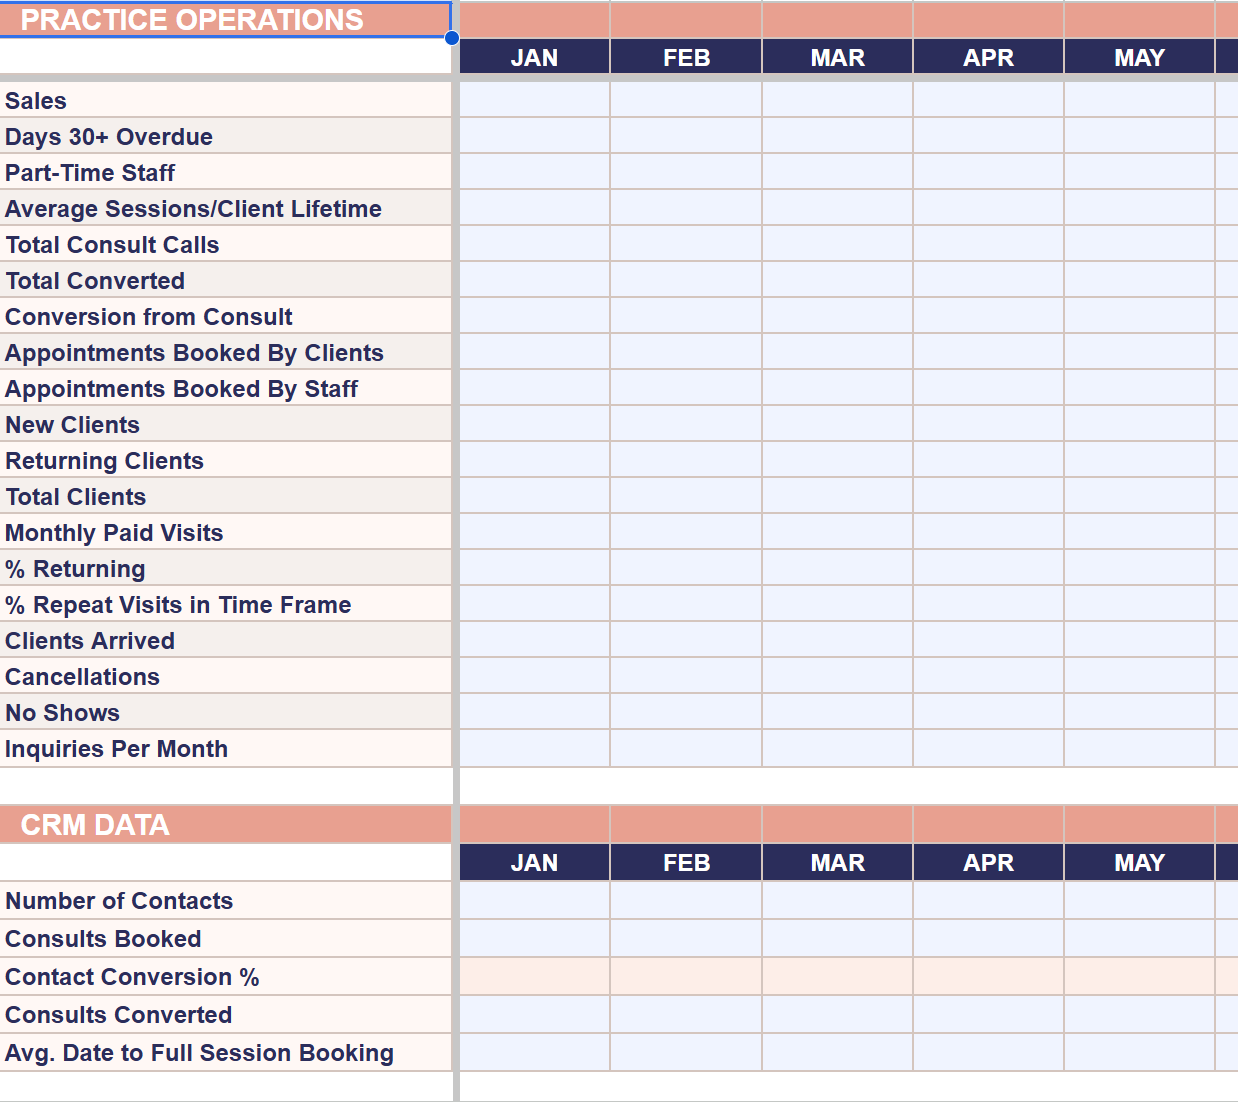
Practice Data tab — Track monthly sales, consult calls, conversion rates, new vs. returning clients, cancellations, no-shows, CRM data, sales breakdown by service type, and referral sources. Totals and conversion percentages calculate automatically.
Marketing Data tab — Google Search Console metrics (clicks, impressions, CTR, search ranking), website analytics (visits, bounce rate, traffic sources), social media performance (Instagram, Facebook), and return on ad spend. Everything in one view.
Therapist Data tab — Individual performance tracking for up to 10 therapists: sessions per month, client lifetime averages, consult conversions, utilization rates, and overdue notes. Averages auto-calculate as you add months.
Weekly Sales Data tab — Granular weekly tracking for sales, consults, first visits, no-shows, and session counts. 52 rows pre-formatted for the full year.
Auto-Populating Charts tab — Five visual charts (monthly revenue, new clients, consult volume, website traffic, cancellations & no-shows) that build themselves as you enter data. Ready to drop into quarterly presentations.
Instructions tab — A complete, plain-language guide that tells you exactly where to find each number in your practice management system and how to enter it. No guesswork.
Built for the first of every month. The dashboard is designed around a simple monthly ritual: pull the previous month's numbers from your PMS (Jane, SimplePractice, etc.), your website analytics, and your Google Search Console — then enter them into the dashboard. The charts update. The trends emerge. And you have the data you need for quarterly reviews, strategic planning, and year-end presentations.
Who this is for:
This is for group practice owners who know they need to be tracking data but haven't had time to build the system. Whether you're running a 3-person practice or a 15-clinician team, this dashboard scales with you. It's especially useful if you're using Jane App, but the metrics and structure work with any practice management system.
Designed by a group practice owner who built this system for her own 9-clinician practice — and used the data to grow from startup to 300+ sessions per month.
Finally see the full picture of your group practice — without building a dashboard from scratch.
You know you should be tracking your numbers. Revenue, conversion rates, therapist utilization, marketing ROI — the metrics that actually tell you whether your practice is growing or just staying busy. But between running the clinical side, managing a team, and trying to keep your own caseload afloat, who has time to build a tracking system from zero?
This ready-to-use data dashboard gives you a complete, structured system for tracking every metric that matters in a group therapy practice — monthly. No spreadsheet skills required. No expensive software. Just open it, follow the step-by-step instructions, and start entering your numbers.
What's inside:
Practice Data tab — Track monthly sales, consult calls, conversion rates, new vs. returning clients, cancellations, no-shows, CRM data, sales breakdown by service type, and referral sources. Totals and conversion percentages calculate automatically.
Marketing Data tab — Google Search Console metrics (clicks, impressions, CTR, search ranking), website analytics (visits, bounce rate, traffic sources), social media performance (Instagram, Facebook), and return on ad spend. Everything in one view.
Therapist Data tab — Individual performance tracking for up to 10 therapists: sessions per month, client lifetime averages, consult conversions, utilization rates, and overdue notes. Averages auto-calculate as you add months.
Weekly Sales Data tab — Granular weekly tracking for sales, consults, first visits, no-shows, and session counts. 52 rows pre-formatted for the full year.
Auto-Populating Charts tab — Five visual charts (monthly revenue, new clients, consult volume, website traffic, cancellations & no-shows) that build themselves as you enter data. Ready to drop into quarterly presentations.
Instructions tab — A complete, plain-language guide that tells you exactly where to find each number in your practice management system and how to enter it. No guesswork.
Built for the first of every month. The dashboard is designed around a simple monthly ritual: pull the previous month's numbers from your PMS (Jane, SimplePractice, etc.), your website analytics, and your Google Search Console — then enter them into the dashboard. The charts update. The trends emerge. And you have the data you need for quarterly reviews, strategic planning, and year-end presentations.
Who this is for:
This is for group practice owners who know they need to be tracking data but haven't had time to build the system. Whether you're running a 3-person practice or a 15-clinician team, this dashboard scales with you. It's especially useful if you're using Jane App, but the metrics and structure work with any practice management system.
Designed by a group practice owner who built this system for her own 9-clinician practice — and used the data to grow from startup to 300+ sessions per month.